Graphing with Folium
Polars H3 includes optional helpers for visualizing H3 cells on an interactive Folium map. Install Folium for coverage and outline maps; metric-colored fills additionally require Matplotlib:
plot_hex_outlines
Plot hexagon outlines on a Folium map.
plot_hex_outlines(
    df: pl.DataFrame,
    *,
    hex_id_col: str,
    map: Any | None = None,
    outline_color: str = "red",
    map_size: Literal["medium", "large"] = "medium",
) -> Any
Parameters
- df : pl.DataFrame
A DataFrame that must contain a column of H3 cell IDs. - hex_id_col : str
Column name indfcontaining H3 cell IDs (hexagon identifiers). - map : folium.Map or None
An existing Folium map object on which to plot. IfNone, a new map is created. - outline_color : str
Color used to outline the hexagons. Defaults to"red". - map_size :
{"medium", "large"}
The size of the displayed map."medium"sets width and height to 50%;"large"sets them to 100%.
Returns
- Any
A Folium map object with hexagon outlines added.
Examples
import folium
import polars as pl
import polars_h3 as plh3

cells = (
    pl.DataFrame({"lat": [40.7580], "lng": [-73.9855]})
    .select(cell=plh3.latlng_to_cell("lat", "lng", 8))
    .select(cell=plh3.grid_disk("cell", 2))
    .explode("cell")
)

base_map = folium.Map(tiles=None)
folium.TileLayer(
    tiles=(
        "https://server.arcgisonline.com/ArcGIS/rest/services/Canvas/"
        "World_Light_Gray_Base/MapServer/tile/{z}/{y}/{x}"
    ),
    attr="Tiles © Esri",
    name="Light Gray Canvas",
).add_to(base_map)

my_map = plh3.graphing.plot_hex_outlines(
    cells,
    hex_id_col="cell",
    map=base_map,
    outline_color="#1E54B7",
)
my_map

Errors
ValueError: If the input DataFrame is empty.ImportError: Iffoliumis not installed.
plot_hex_fills
Render filled hexagonal cells on a Folium map, colorized by a specified metric.
plot_hex_fills(
    df: pl.DataFrame,
    *,
    hex_id_col: str,
    metric_col: str,
    map: Any | None = None,
    map_size: Literal["medium", "large"] = "medium",
) -> Any
Parameters
- df : pl.DataFrame
A DataFrame that must contain columns for H3 cell IDs and a metric to color by. - hex_id_col : str
Column name containing H3 cell IDs. - metric_col : str
Column name containing metric values for colorization. - map : folium.Map or None
An existing Folium map object. IfNone, a new map is created. - map_size :
{"medium", "large"}
The size of the displayed map."medium"sets 50% width/height,"large"sets 100%.
Returns
- Any
A Folium map object with filled hexagons colorized by the specified metric.
Examples
>>> df = pl.DataFrame({
...     "hex_id": [599686042433355775, 599686042433355776],
...     "some_metric": [10.0, 42.0],
... })
>>> # 'hex_id' and 'some_metric' must be valid
>>> import polars_h3 as plh3
>>> my_map = plh3.graphing.plot_hex_fills(
...     df,
...     hex_id_col="hex_id",
...     metric_col="some_metric",
... )
>>> my_map
Errors
ValueError: If the input DataFrame is empty.ImportError: Iffoliumormatplotlibis not installed.
Note
plot_hex_outlines requires Folium. plot_hex_fills uses both Folium and
Matplotlib for color scaling. These packages are imported only when a
graphing function is called.
plot_polygon_coverage
Overlay H3 cells and their row-aligned source geometry for visual auditing.
The geometry column accepts the same WKT String or WKB/EWKB Binary values
as polygon_to_cells; explicit EWKB SRIDs must be 4326. The cell column may
contain one cell per row or a List produced directly by polygon_to_cells.
plot_polygon_coverage(
    df: pl.DataFrame,
    *,
    geometry_col: str,
    cells_col: str,
    map: Any | None = None,
    cell_color: str = "#2563eb",
    cell_fill_opacity: float = 0.2,
    geometry_color: str = "#dc2626",
    map_size: Literal["medium", "large"] = "large",
) -> Any
coverage_map = plh3.graphing.plot_polygon_coverage(
    state_covered,
    geometry_col="wkb_geometry",
    cells_col="h3_cells",
)
coverage_map
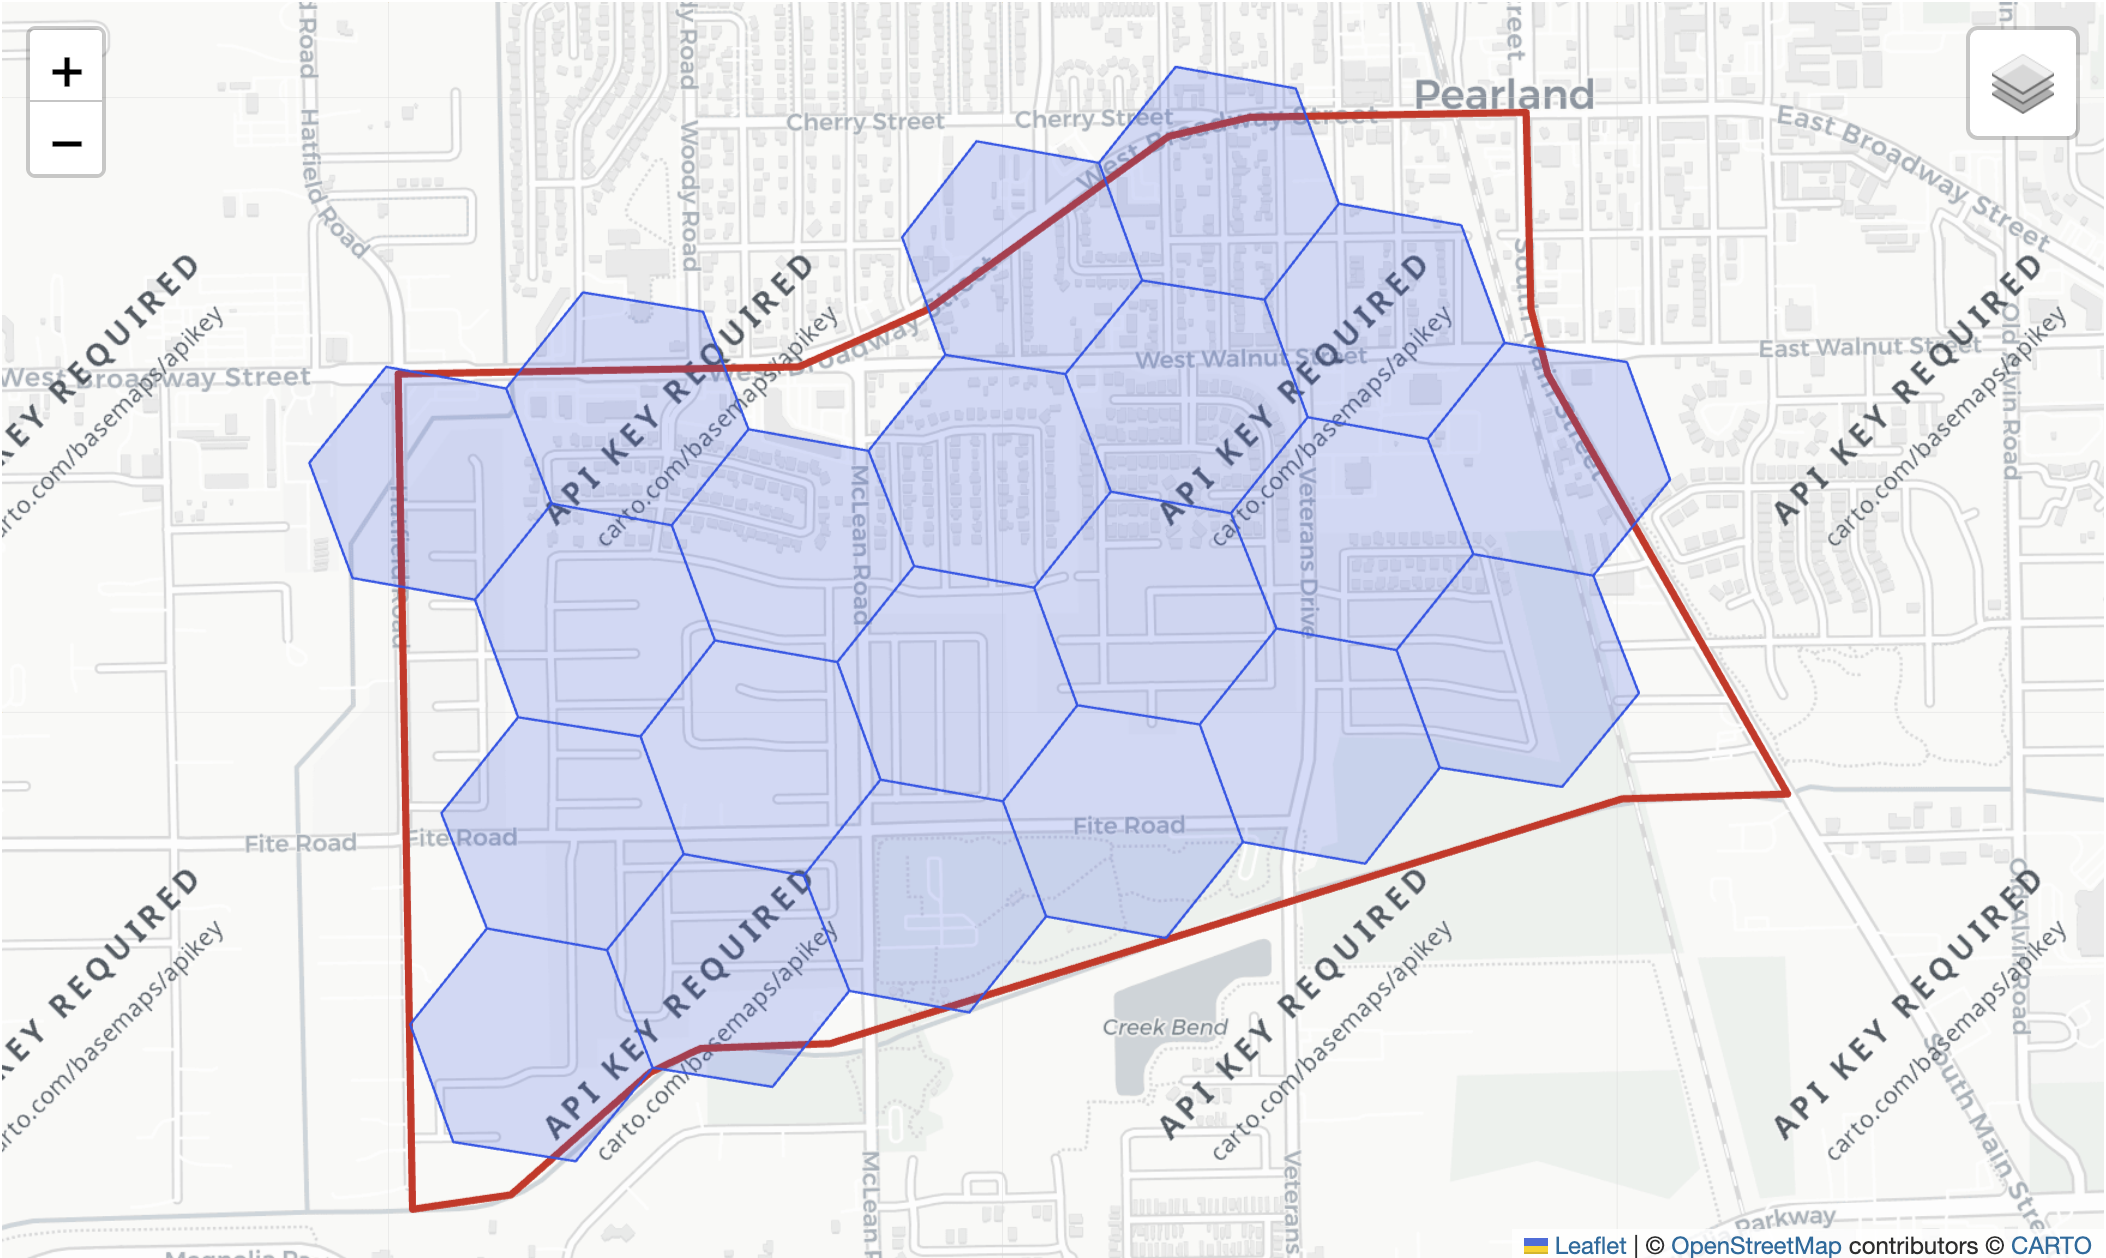
The default map deduplicates repeated geometries and cells, draws translucent blue H3 cells and red source boundaries, fits both toggleable layers, and shows the H3 index on hover. Null values are skipped. A valid geometry with an empty coverage is still drawn, which makes coarse-resolution misses visible.
Coordinates must use WGS84 longitude/latitude order. Folium maps are intended
for interactive audits of moderate coverages; very large cell sets produce
large HTML output. Leaflet may display antimeridian-crossing polygons with
world-spanning bounds, so dateline visualization is currently limited even
though polygon_to_cells accepts those geometries.
Malformed non-null geometries and invalid non-null cells raise errors instead of being silently omitted.